There’s geography in maps, which we often rely on to get us from point A to point B. There’s also history in maps, as older ones show us how the layout of a town changed from one era to another. Little considered, though, is the storytelling in maps. But a visit to the Stephen S. Clark Library has examples of pictorial maps that, while rarely to scale, tell a story.
“Maps use and are a visual language, and they bring people together,” says Timothy Utter, ’88, Clark Library’s manager and map librarian. “Whether I view maps with one person or a whole class, I experience a shared curiosity and connection as we interpret and make sense of the story that each map is telling us.”
Located on the second floor of the Hatcher Graduate Library, the Clark Library includes maps from 1525 to the present that range from the whimsical to the precise.
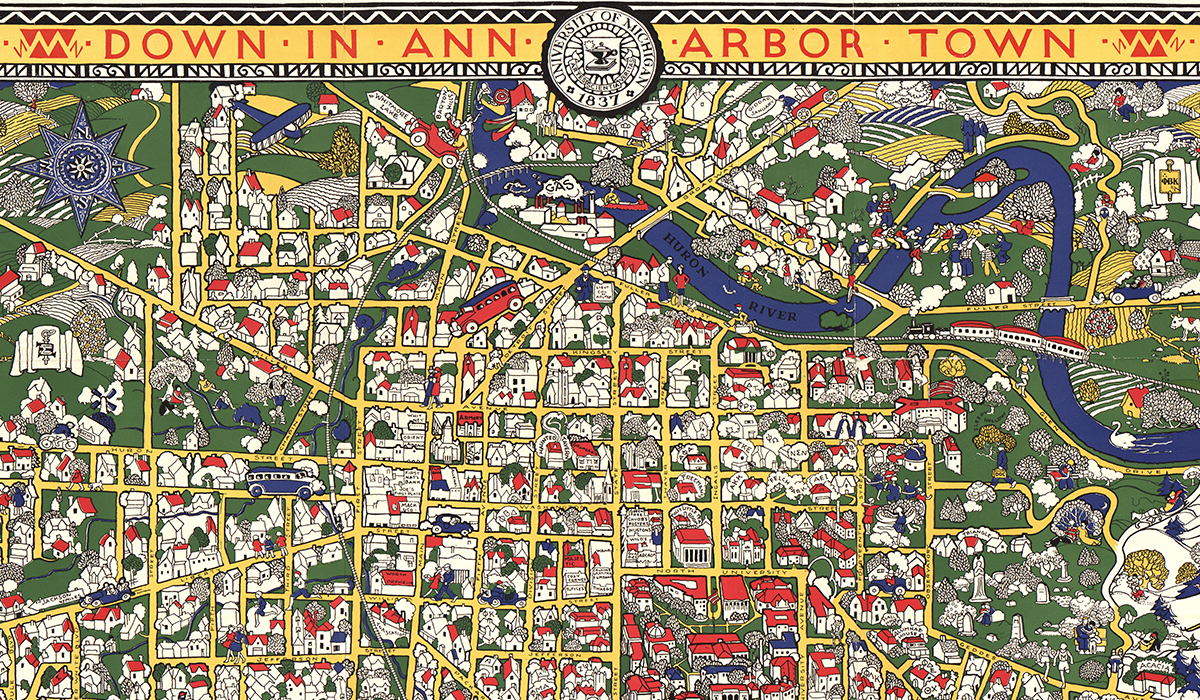
For example, not every Ann Arbor street is located on “Down in Ann Arbor Town Where No One Asks the Who or Why: University of Michigan, the College Whose Colors We Wear.” Gertrude Strickler and Jessie Horton Koessler, 1901, drew and produced this map in 1926 and sold it to raise money to construct the Michigan League, which broke ground in 1927. Events like Lantern Night and Union Opera, local businesses, and student hangouts are illustrated, as are fraternities and sororities. Utter points out that very few dorms existed before the 1930s and most of those that did housed women exclusively. Most students joined a Greek house or lived in a boarding house.
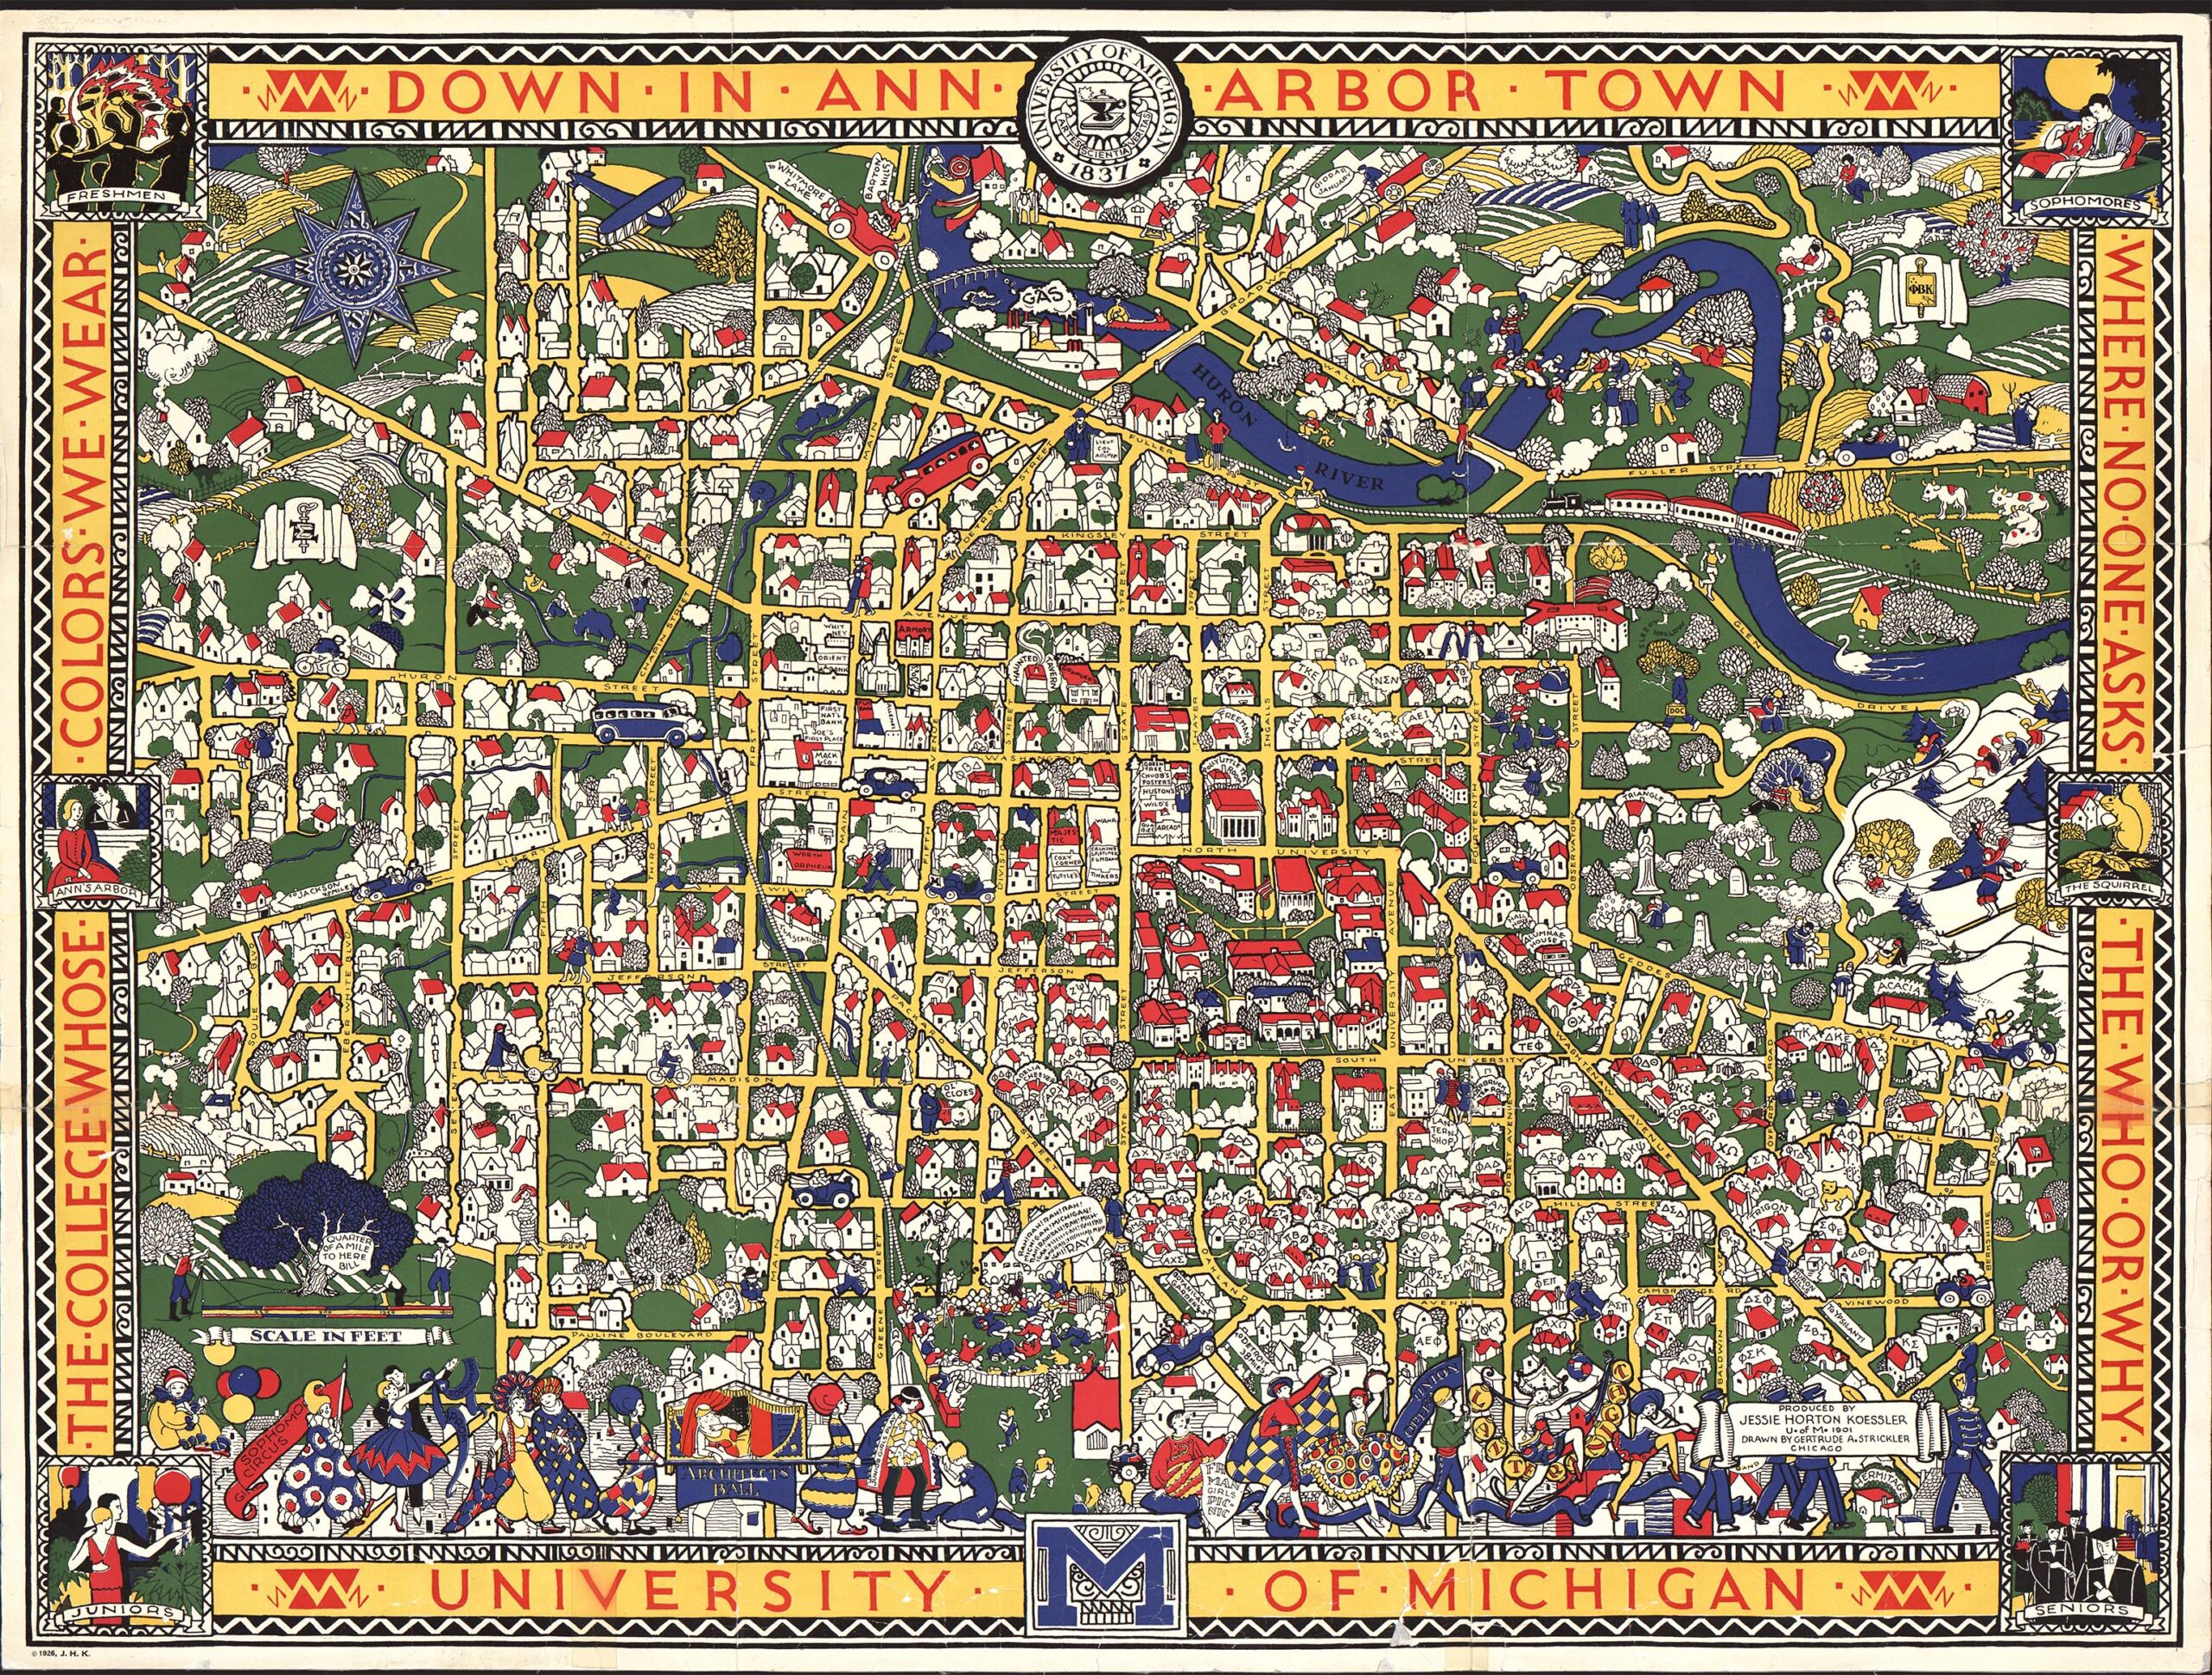
The women were influenced by a 1914 art deco map of London created by MacDonald Gill to increase riders on the London underground. The “Wonderground Map of London Town” may have been the first map that favored primary colors, focusing on and sometimes satirizing local people and events. Contemporary reports claimed people spent so long looking at the whimsical map that they missed their trains—and didn’t complain about it. The map, in an almanac at the Clark Library, inspired maps in other cities from Melbourne to Mexico City to Ann Arbor.
A much more precise map is the 1748 “Pianta Grande di Roma” (Large Plan of Rome) by engraver Carlo Nolli and etcher Giovanni Battista Nolli. The Colosseum, the Pantheon, columns, arches, baths, churches, palazzos, gardens, fountains, and bridges are indicated and indexed on the map adorned by exquisite art. It took 10 years to survey the city and create the map. Until the mid-20th century, it was the most accurate one of Rome available.
People visit the Clark Library to learn about genealogy, how their community or the world has changed, or disciplines that include art, archeology, and anthropology. Its map-heavy collection also includes almanacs and globes as well as numeric and geospatial data, some of which are U.S. and international government documents. Data visualization services and a geographic information system that creates, manages, analyzes, and maps all types of data are also available. It even has a map of the planets. Apparently, the sky is not the limit at the Clark Library.
Is there a U-M space that you’d like to learn more about? Email [email protected] with your suggestion.